📈 Quantifying 'The Curve'
A naive attempt at COVID curve fitting
With COVID-19 being at the top of everyone’s mind, I decided to poke around with
some of the data floating around the internet. It seems that the Johns Hopkins University data-set is among the most used sources.
It also allowed me to acquaint myself with a new and exciting part of science: data science.
I stocked up my toolbox with Python, Jupyter and pandas and went to work.
All my code can be found on GitHub:
https://github.com/JeppeKlitgaard/COVID-19
Getting the data
It consists of a covid package that contains methods for grabbing the Johns
Hopkins University data as a neatly formatted pandas.DataFrame, indexed by
country and date.
In order to get metrics per population a population column is added by using
data from data.worldbank.org via the wbdata Python package and the
SP.POP.TOTL indicator.
We then just iterate over the three metrics and calculate the metric_per_1M
column.
Processing the data
Since the COVID outbreak did not start at the same time everywhere around the
world it makes sense to index the data based on the number of days, rel_day,
since a threshold amount of a given metric was reached. For example, we may want
to index based on the number of days since 10 deaths were recorded for the
country/region.
This is done by applying the covid.utils.get_x_day function country-wise:
A simple mathematical model that fits our data reasonably is a Logistic Fit
model, as described by covid.statistics.LogisticMode which we can fit to using
the lmfit Python package for each country.
Graphing our data and fit
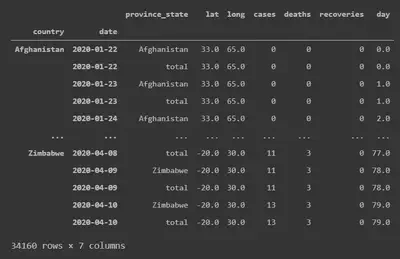
We can now plot the Johns Hopkins data and our fit using matplotlib, giving
nice graphs with standard errors like the one below. Feel free to download the
git repository and have a play with the data in the COVID_data.ipynb Jupyter
notebook yourself.

In the legend we also find the 3 parameters from our logistic fit, where the c
value corresponds to the maximum number of deaths per 1 million population
reached according to the crude logistic model.
As a Dane living in the UK, I find it interesting to see how the governmental responses of Sweden, the UK and Denmark seem to correlate to the number of deaths per population. Particularly Sweden is very comparable to Denmark in many regards, but has chosen a wildly different strategy for dealing with COVID-19.
For the time being, the predicted number of US deaths per population is quite low, but that is probably explained by the fact the outbreak is still fairly contained to a few major cities. The model is unable to take this into consideration, and given the media coverage surrounding the US response so far, it seems likely that the death toll there will be much larger than that described by the model.
Breaking the curve
In order to see when the curve is “broken”, we can change the y-axis to a log
scale to get:
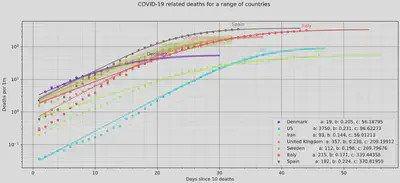
We see that the US has only just broken the curve, while hard-hit countries like Spain and Italy seem to finally see the results of their strict lock-downs.
All countries
Here is the graph for all countries — it is a bit busy.
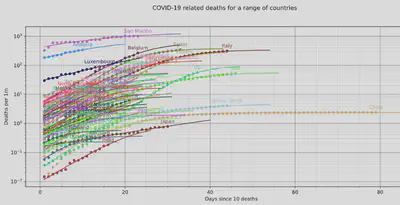
It should be noted that the tool also does
cases
and
recoveries, but
deaths was chosen as this is probably the most reliable number across the
different countries.
Conclusion
For me this was a really nice way of playing around with the rather tragic COVID-19. I was quite surprised to see just how well the logistic model fits the data, though it does not account for the fact that societies will eventually have to reopen, which will likely result in a second ‘wave’.
I hope this was at least interesting and hopefully the git repository can serve as a starting point for the next guy looking to poke around with the data.
NOTE: I myself took
https://github.com/willhaslett/covid-19-growth/
as a starting point for using the Johns Hopkins data and covid.constants is
shamelessly stolen from there.
Jeppe Klitgaard
Physics Student
Just another enthustiastic polymoron thinking out loud. Aspiring goodish person.